

Part 2 of 2 - 10k time trial effort with Stryd Power Meter

This is a follow up post to the first one that I had written on running with power. You can read the earlier post here to gain perspective on what training with a Stryd power meter is all about.
In this post I will share my experience of running a 10km Time Trial based on power as a metric and also give the readers an insight on how to plan your run based on the race predictor feature in Stryd. Let’s get going …
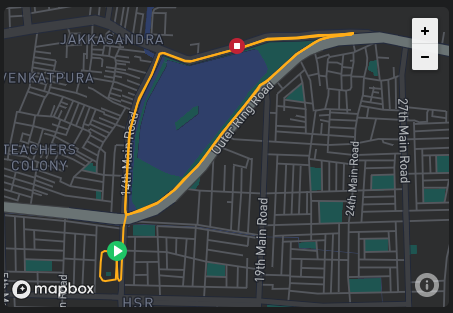
A small background on the course and conditions before we dive into the specifics of the time trial in itself. I had chosen a 3.5km loop around the Agara lake in HSR layout in Bangalore. This is a road that surrounds the park that encompasses the trail and the lake. This is a flat stretch with some minor undulations and a sharp turn on one side. The runner does face some headwinds in one particular section but by and large this is a good course for a fast time trial. The first kilometer involved a short loop of the HSR BDA complex from where I started my time trial and the next 9kms were run on this 3.5km loop.
The weather conditions were not all that good. About 27 deg-C and 98% humidity at 6:30 AM in the morning. In retrospect I should have factored these variables in my plan and revised the target.
Speaking of targets, I used the Stryd race predictor feature to estimate my target power and finish time for this time trial. This is a nifty feature from Stryd that predicts the target time and power basis training data from the last 90 days and parameters such as Surface, Elevation, Temperature and Humidity. This is how my target power and finish time predictions look like as I write this article now …
While planning for the time trial, the race predictor gave me a finish time of 42m:30s with a tolerance of about +/- 30 seconds if I ran at my Critical Power (CP) of 270W.

Now all this prediction business was a little vague to me. This is where the STRYD community, a facebook group by Stryd came to my rescue. I posted a question on how to go about maintaining 270W power through the time trial. The answer that I got was simple – Start out just under, finish strong!
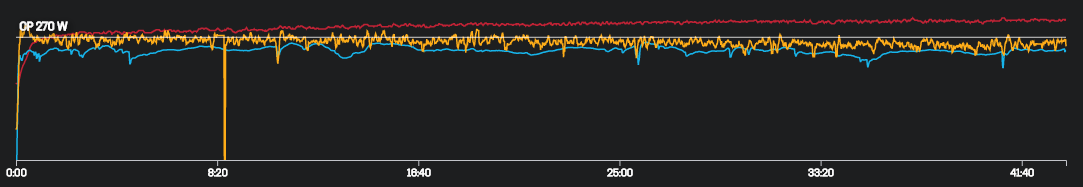
Easier said than run 😉, as advised I started just under at about 262W but thereafter I could never scale up to the predicted power target of 270W. My average power kept falling steadily and dropped to its lowest in the final kilometer at 253W. The chart below illustrates pace (blue line), heart rate (red line) and average power(yellow line) variation across the time-trial effort …
And here are the splits with a variety of data-points that Stryd shows.

For the sake of this discussion let us just focus on the parameters illustrated above viz. pace, heart rate and average power. As can be seen, the average power and pace kept dropping with distance while the heart rate kept climbing up. More important, I was not able to run at the predicted power viz. 270W (which also happens to be my critical power aka CP) for even a single km.
What could be the reasons for this indifferent performance? let us explore them …
Let me explain the phrase - Lack of “power aware” training. In the lead up to this time trial I had attempted 5km sets [5km1 set / (5km2 sets with a 60-90 second RI)] at close to the predicted power on the same course. One interesting observation here is the fact that I was not able to hold the predicted power across the 5km*2 sets workouts. This was an indication even before the time trial that holding a predicted power which was close to the critical power was not going to be easy.
One may ask – given that this limitation was exposed in training by Stryd, how did race predictor suggest an apparently unattainable power target? May I remind the readers that Stryd race predictor uses the training data over the last 90 days to make an informed prediction, with a tolerance range. So back in late July in a small “race” at the outskirts of the city I had run my 10km PB of 41:59 minutes. I guess the race predictor would have used this data to estimate the target power for this time trial.
So, clearly, this was a chink in the armor vis a vis my training towards the time-trial. By extension the next set of pertinent questions would be …
The discerning reader would have noticed the double quotes around the word duration 😊. This is the right time to introduce the concept of “Power Duration Curve”.
As per Stryd,
The power duration curve is your best effort power (in Watts) at any given duration (up to five hours) that you’ve done over the defined period of time.
The view defaults to the last 90 days because that best captures your current ability and is used to determine your Critical Power. In my experience of using Stryd, the power duration curve is the heart of the Stryd power meter. Illustrated below is my power duration curve …
I will be touching upon one key insight that dawned upon me as I analyzed my power duration curve – fatigue resistance. Armed with this key insight let us revisit the earlier questions …
What could be the “duration” for which I can hold a predicted power that is close to my critical power?
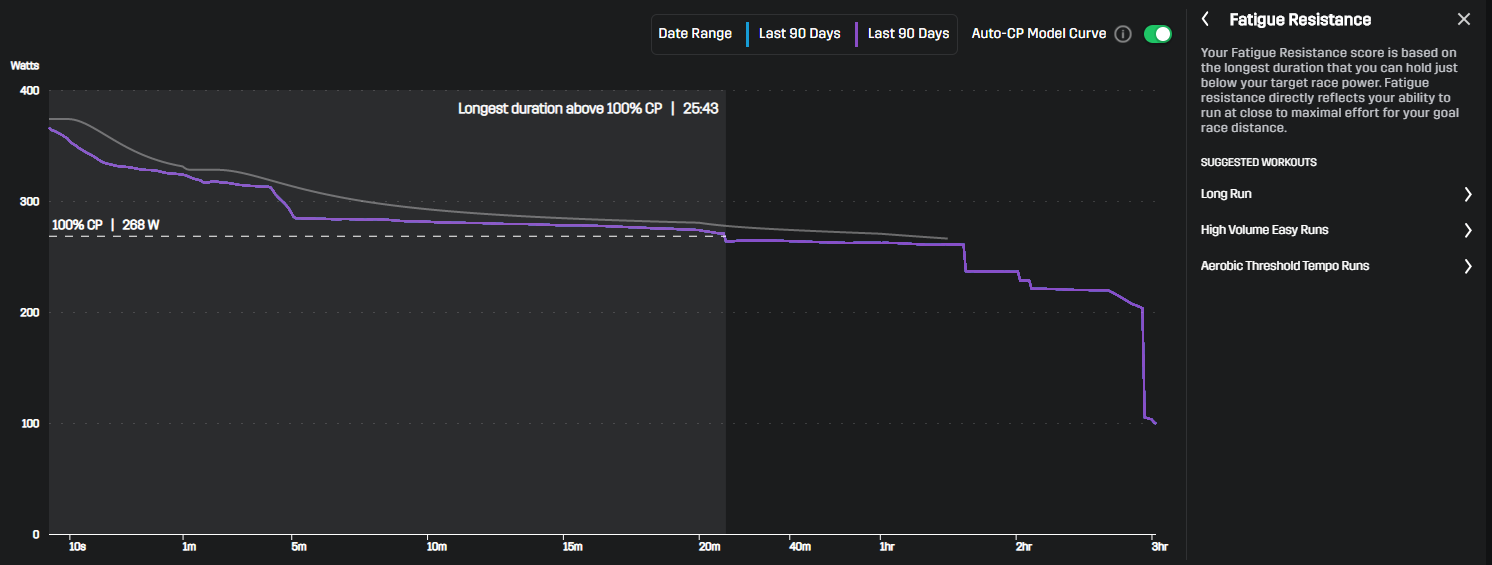
Ans> As is evident the longest duration for which I had run above 100% CP is 25:43 minutes. I was clearly not primed for running a 10km at 100% CP aka Critical Power.
What sort of workouts would I need to incorporate into my training so as to increase the “duration” for which I can hold an effort at critical power or in close proximity to that value?
Ans> As per the training distribution tab of Stryd Power Center (more on this in a future article) I need to work on my fatigue resistance. Fatigue resistance directly reflects ability to run at close to maximal effort for your goal race distance. The suggested workouts are …
Long Runs: A long continuous run for the purpose of improving your overall endurance
High Volume Easy Runs: Running for extended periods at 50-80 % of your Critical Power strengthens your aerobic ability and helps your body become more efficient at the general “skill” of running
Aerobic Threshold Tempo Runs: Sustained efforts slightly lower than your Critical Power to specifically target your ability to extend high end threshold running without going over your personal limit.
Please note the “power aware” context of the suggested workouts above. The intensity of each workout is defined based on the Critical Power as a metric as against the usual suspects i.e. Pace or Heart Rate.
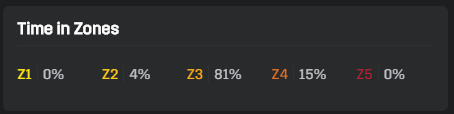
In the first part of this series I had shared my power zones. Power Zone 3 (Z3) corresponds to a threshold zone and Power Zone 4 (Z4) corresponds to interval zone. Shared below is the time I spent in each power zone during this time trial …
Illustrated below is the same power duration curve (in blue), but this time I have added the Auto-CP Model curve from Stryd(white). This curve estimates the “theoretical best effort you can hold for different periods of time”. We are looking at the variance between the actual peak power and the modeled peak power for a duration of 42:30 minutes (the finish time from the Stryd Race Predictor). There is a 10W variance in peak power between the actual and modeled ability.
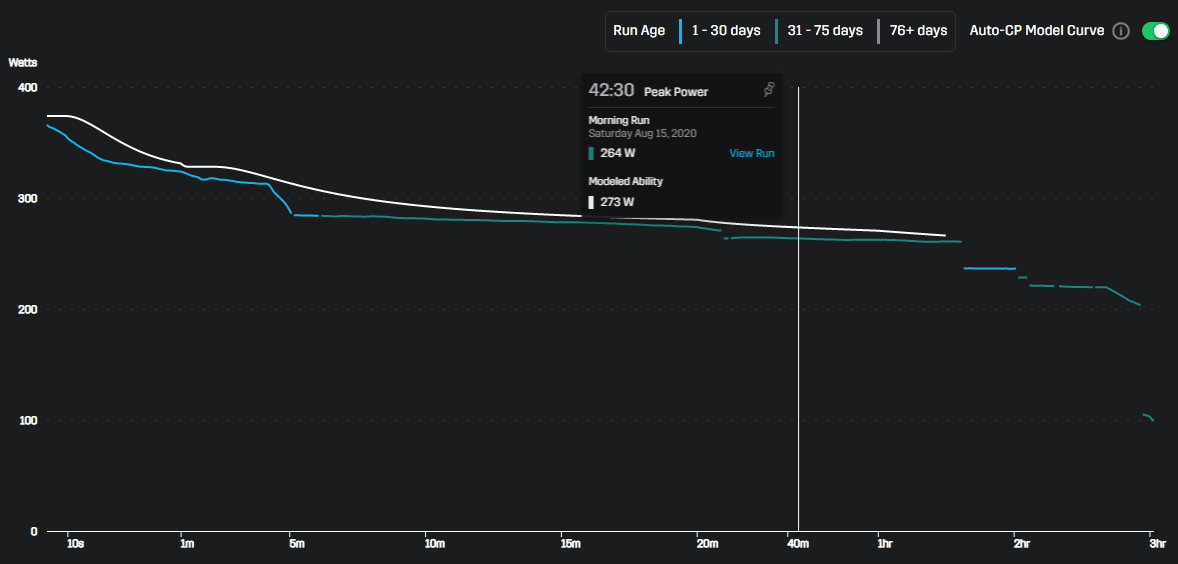
To put things in perspective I would like to draw the reader’s attention back to the splits table shared above. I was able to maintain an average power of 263-264W until the halfway mark after which the power values started going South with the result that the average power for the Time Trial was only 259W a full 5-6 W lesser than the actual peak power I am capable of holding for this duration.
I would like to conclude this post with the stats for the Time Trial. I finished the 10km TT in 43:30 mins which was pretty close to what Stryd Race Predictor had indicated. But again, with the right kind of “power aware” workouts the gap between the Modeled CP and the actual peak power can be reduced.

I and my Coach (Ashok Nath) have tweaked the training plan for a 10km race that I will be attempting as part of the BAA virtual challenge in November. Hopefully this “race” will be a more consistent effort in terms of staying at my peak power as recommended by Stryd race predictor. Stay tuned for more updates on this race and also the learnings that I will keep sharing before that …
We put substantial time and resources into bringing this content to India's running community. If you like what we do, consider chipping in — every bit helps keep the lights on.
See the Thank You Wall →
